2024. december 21. szombat
IDŐJÁRÁS - angol nyelvű folyóirat

Vol. 128, No. 4 * Pages 399–496 * October - December 2024
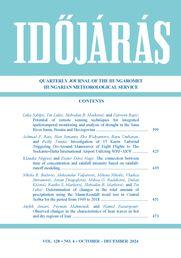

Journal of the Hungarrian Meteorological Service

letöltés [pdf: 3655 KB]
Potential of remote sensing techniques for integrated spatiotemporal monitoring and analysis of drought in the Sana River basin, Bosnia and Herzegovina
Luka Sabljić, Tin Lukić, Slobodan B. Marković, and Davorin Bajić
DOI:10.28974/idojaras.2024.4.1 (pp. 399–423)
 PDF (6345 KB)   |   Abstract

The subject of the research paper is the exploration of the potential of remote sensing techniques for enhanced spatio-temporal monitoring and analysis of drought impacts within the Sana River basin area in Bosnia and Herzegovina (B&H). The aim is to identify meteorological, hydrological, agricultural, and socio-economic drought occurrences by processing remote sensing “products”. An integral part of this aim involves calculating the standardized precipitation index (SPI), temperature condition index (TCI), vegetation condition index (VCI), and vegetation health index (VHI). Meteorological drought monitoring was carried out using the Climate Hazards Group InfraRed Precipitation with Station Data (CHIRPS) dataset processed through the Google Earth Engine (GEE) platform. A 42-year period (1981–2023) was compared with reference years (2016 and 2017). The occurrence of meteorological drought (lack of precipitation) was identified, and SPI was calculated. The period with reduced precipitation and negative SPI values during 2016 and 2017 coincided with the pattern of decreasing water levels in the main stream of the Sana River, confirming the impact of meteorological drought on the occurrence of hydrological drought. Agricultural drought monitoring was conducted using Moderate Resolution Imaging Spectroradiometer (MODIS) satellite data, namely MOD13Q1 and MOD11A2, to calculate TCI, VCI, and VHI. The results indicate negligible drought occurrence for 2016, while extreme agricultural drought was observed in the basin area for 2017. The consequences of agricultural drought on the occurrence of socio-economic drought were examined. The results show an extreme decrease in yields of wheat, barley, corn, potatoes, pears, and plums during 2017 compared to 2016. The research contributes to a better spatio-temporal understanding of drought phenomena, and the presented data and results are significant for numerous practical issues related to monitoring, mitigation, and/or prevention of negative consequences of drought in river basin areas.


Investigation of 15 Knots Tailwind Triggering Go-Around Manoeuver of Eight Flights to The Soekarno-Hatta International Airport Utilizing WRF-ARW
Achmad F. Rais, Heri Ismanto, Eko Widyantoro, Bayu Umbaran, and Rezky Yunita
DOI:10.28974/idojaras.2024.4.2 (pp. 425–438)
 PDF (6086 KB)   |   Abstract

A numerical simulation of the 15 knots tailwind triggering the go-around maneuver of 8 flights at the Soekarno-Hatta International Airport was explored. The Advancer Weather Research an Forecasting (WRF-ARW) numerical weather prediction model was used to simulate the events. The results showed that WRF-ARW with temporal and spatial resolutions of 2 minutes and 1 km could simulate the tailwind events. The tailwind was triggered by the background wind from the Indian Ocean and by cloud initiation near the final approach path (FAP), then the tailwind speed was reduced by the wind gust south of the FAP at 11:00 UTC, on November 3, 2021. These findings cannot be resolved by analyzing in-situ, weather satellite, and radar data with limited coverage and sensing the wind out of the cloud. It suggests that high-resolution numerical simulation can be used in the operation of aviation weather investigation. Assimilating observation data to the model is essential to be investigated for further study to understand the tailwind mechanism more accurately.


The connection between time of concentration and rainfall intensity based on rainfall-runoff modeling
Klaudia Négyesi and Eszter Dóra Nagy
DOI:10.28974/idojaras.2024.4.3 (pp. 439–450)
 PDF (3007 KB)   |   Abstract

The study aims to examine the relation between rainfall intensities and times of concentration based on rainfall-runoff modeling using the recently developed features of the Hydrologic Engeneering Center – Hydrologic Modeling System (HEC-HMS) modeling software. The time of concentration is generally considered a constant characteristic of a catchment. However, various publications have shown that response time is a dynamic property and a function of rainfall intensity. Model simulations were performed to gain more insight into the relationship mentioned. The applicability of the dynamic time of concentration was examined with the help of a recent version of the HEC-HMS software that can interpret the dynamic relationship between time of concentration and rainfall intensity. The models were built for characteristic and dynamic cases. In the characteristic case, the time of concentration values of the catchments were calculated using the commonly applied Wisnovszky empirical equation, while in the dynamic case, the applicability of the rainfall intensity, i.e., the time of concentration function, was examined.  The applicability of the new HEC-HMS feature was reviewed, and the relationship between the time of concentration and rainfall intensity was confirmed. The dynamic approach improved the models’ performance, especially where the Wisnovszky equation yields an inadequate estimation of the time of concentration based on the results.


Determination of changes in the total amount of precipitation using the Mann-Kendall trend test in Central Serbia for the period from 1949 to 2018
Nikola R. Bačević, Aleksandar Valjarević, Milena Nikolić, Vladica Stevanović, Jovan Dragojlović, Milica G. Radaković, Dušan Kićović, Rastko S. Marković, Slobodan B. Marković, and Tin Lukić
DOI:10.28974/idojaras.2024.4.4 (pp. 451–472)
 PDF (2315 KB)   |   Abstract

This study presents the trend analysis for a specific category of variables, namely the average annual precipitation. The geospatial distribution of the obtained results in Central Serbia is visualized using Geographic Information System (GIS) numerical analysis. The primary objective of this study is to identify potential changes in the trends of average annual precipitation within the observed area. Methodologically, the Mann-Kendall trend test, trend equation, and trend magnitude were employed for trend analysis. The data used for the analysis were sourced from the Meteorological Yearbooks of the Republic Hydrometeorological Service of Serbia, encompassing a total of 24 meteorological stations and spanning the period from 1949 to 2018. Based on the obtained results, statistically significant positive trends were observed in 17 time series, favoring the alternative hypothesis. Conversely, a decline in precipitation was noted in the remaining 7 time series. Among the time series, the largest increases in the total amount of precipitation over the past 69 years were recorded ont he area of the Dinaric Mountains. Conversely, the lowest increase in average precipitation was observed in the central part od the country.Furthermore, the time series with the greatest decrease in average annual precipitation was recorded ont he southeastern part of the country. In order to effectively address water-related challenges associated with precipitation fluctuations, it is essential to gain a comprehensive understanding of the shifting trends in precipitation over the region of Central Serbia.


Observed changes in the characteristics of heat waves in hot and dry regions of Iran
Atefeh Ansari, Peyman Mahmoudi, and Hamid Nazaripour
DOI:10.28974/idojaras.2024.4.5 (pp. 473–496)
 PDF (3348 KB)   |   Abstract

Research on heat waves is greatly important not only due to their effect on social, economic, and ecological systems, but also due to the complexity of the processes that create them. Therefore, this research mainly investigated the trend of long-term changes in various characteristics of heat waves in hot and dry regions of Iran. For this purpose, the daily maximum temperature data of 15 meteorological stations in the central and southeastern parts of Iran were used from 1985 to 2018. Using the excess heat factor (EHF) index,  five different features of heat waves including the number of heat waves (HWN), heat waves duration (HWD), heat waves frequency (HWF), heat waves mean (HWM), and heat waves magnitude (HWA) were extracted for all the studied stations. Then, their trend of long-term changes was analyzed using the Sen’s slope estimator nonparametric method. The results showed that on a regional scale, all five characteristics of heat waves have an increasing trend at a significance level of 95%, so an increase of 0.5 events per decade has been observed for the HWN. The trend of long-term changes in the HWD has also indicated an increase of 0.91 days per decade. The HWF has shown more drastic changes than other characteristics of heat waves, so in every decade 2.61 days have been added to the frequency of days contributing to the occurrence of heat waves. The regional intensity of HWM and HWA also show an increase of 0.1 and 0.4 °C in each decade, respectively. These findings show the importance of choosing a suitable index for monitoring different characteristics of heat waves. The EHF index is a suitable index, which can be one of the efficient indices in this regard.


IDŐJÁRÁS folyóirat